First, let's answer the question, why are Stories so important? In a nutshell:
- About 500 million users use Stories every day. (Statista).
- In 2020, the click-through rate on Stories was 68%. (Marketing Charts).
- U.S. marketers allocate about 31% of their budget to promotion in Stories. (eMarketer)
- 61% of users placed a "Support Small Business" sticker in their Stories in just one month. (EarthWeb)
As we can see,Stories can be a powerful tool for promoting your account/business, if used correctly. That's what Stories are for. This article is designed to help you:
- find the stats tab
- better understand the different stats to analyze the data.
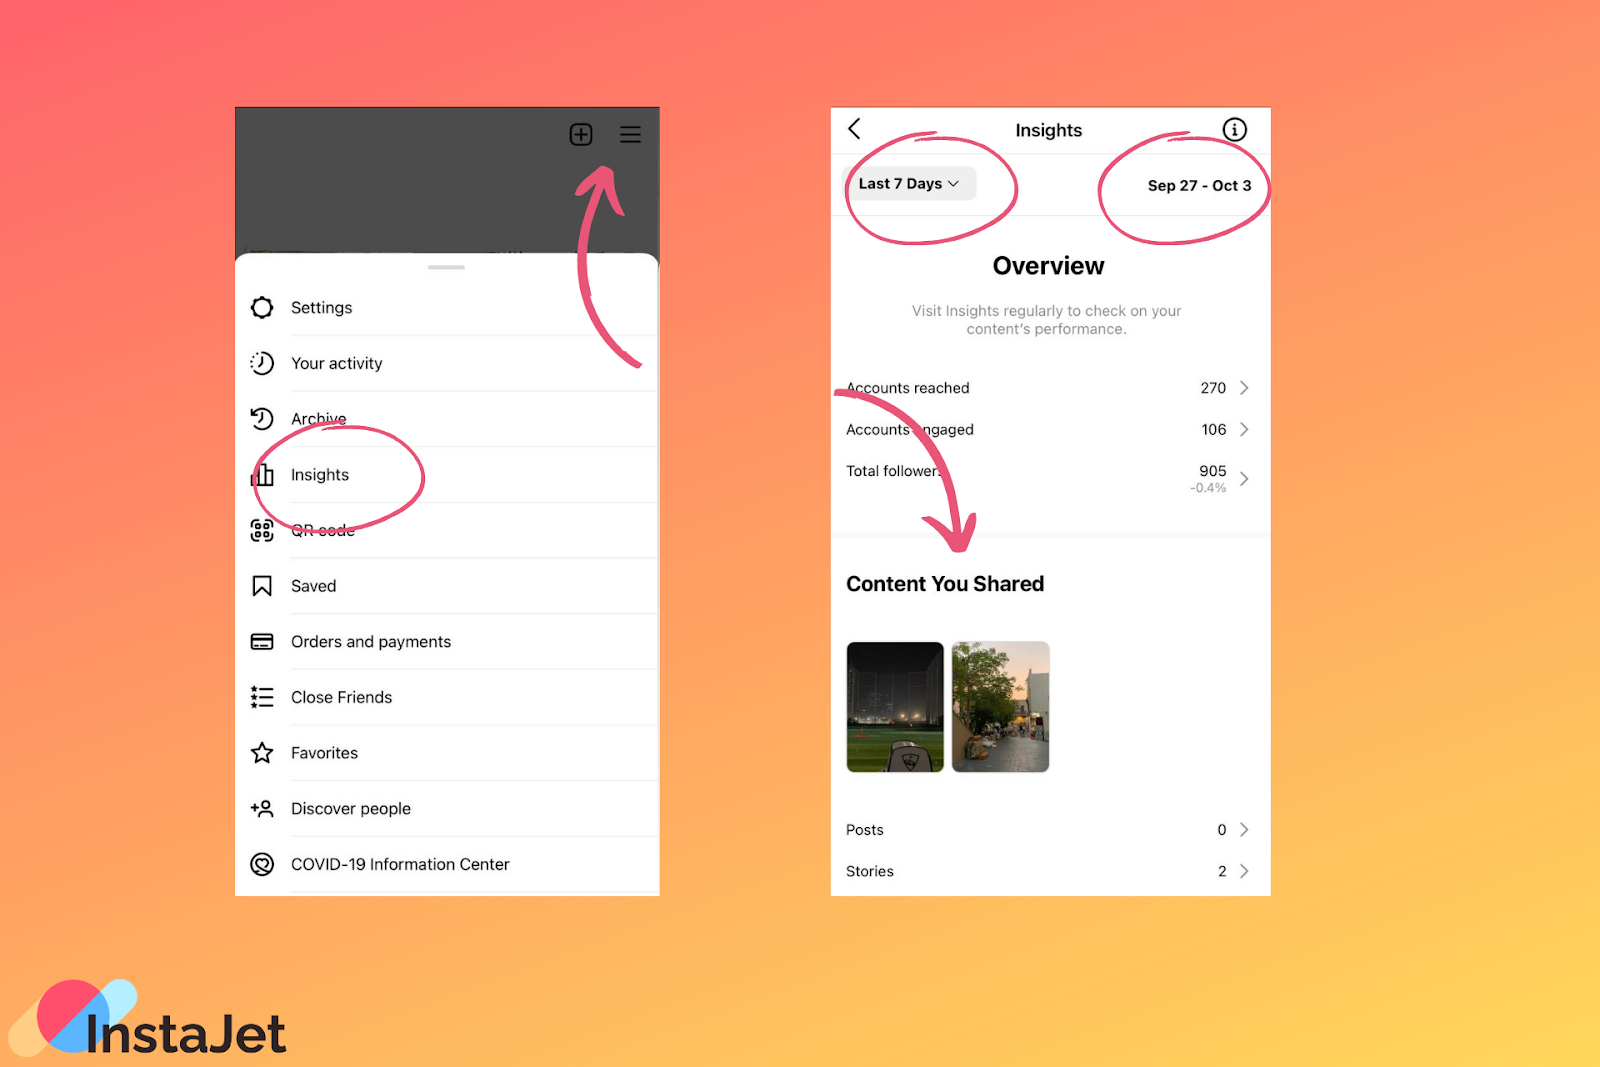
Viewing general statistics for Stories
To start, from your profile tab, click on the three dashes in the upper right corner of your screen, and select "Insights" Then scroll to the "Content You Shared" section. In this section, there are different time periods that you can select to see your published posts, including Stories, and statistics on them, but the choice is limited to the last 90 days. Stories can also be sorted from newest to oldest, and vice versa, as well as filtered by one of the metrics. You can read more about the available metrics below.
Viewing Statistics for a Single Story
To view an individual Story's stats, open it by clicking on the avatar and then select the avatar previews in the lower left corner.
Now let's go directly to the various statistical metrics and figure out what they reflect.

Basic Metrics and what they stand for
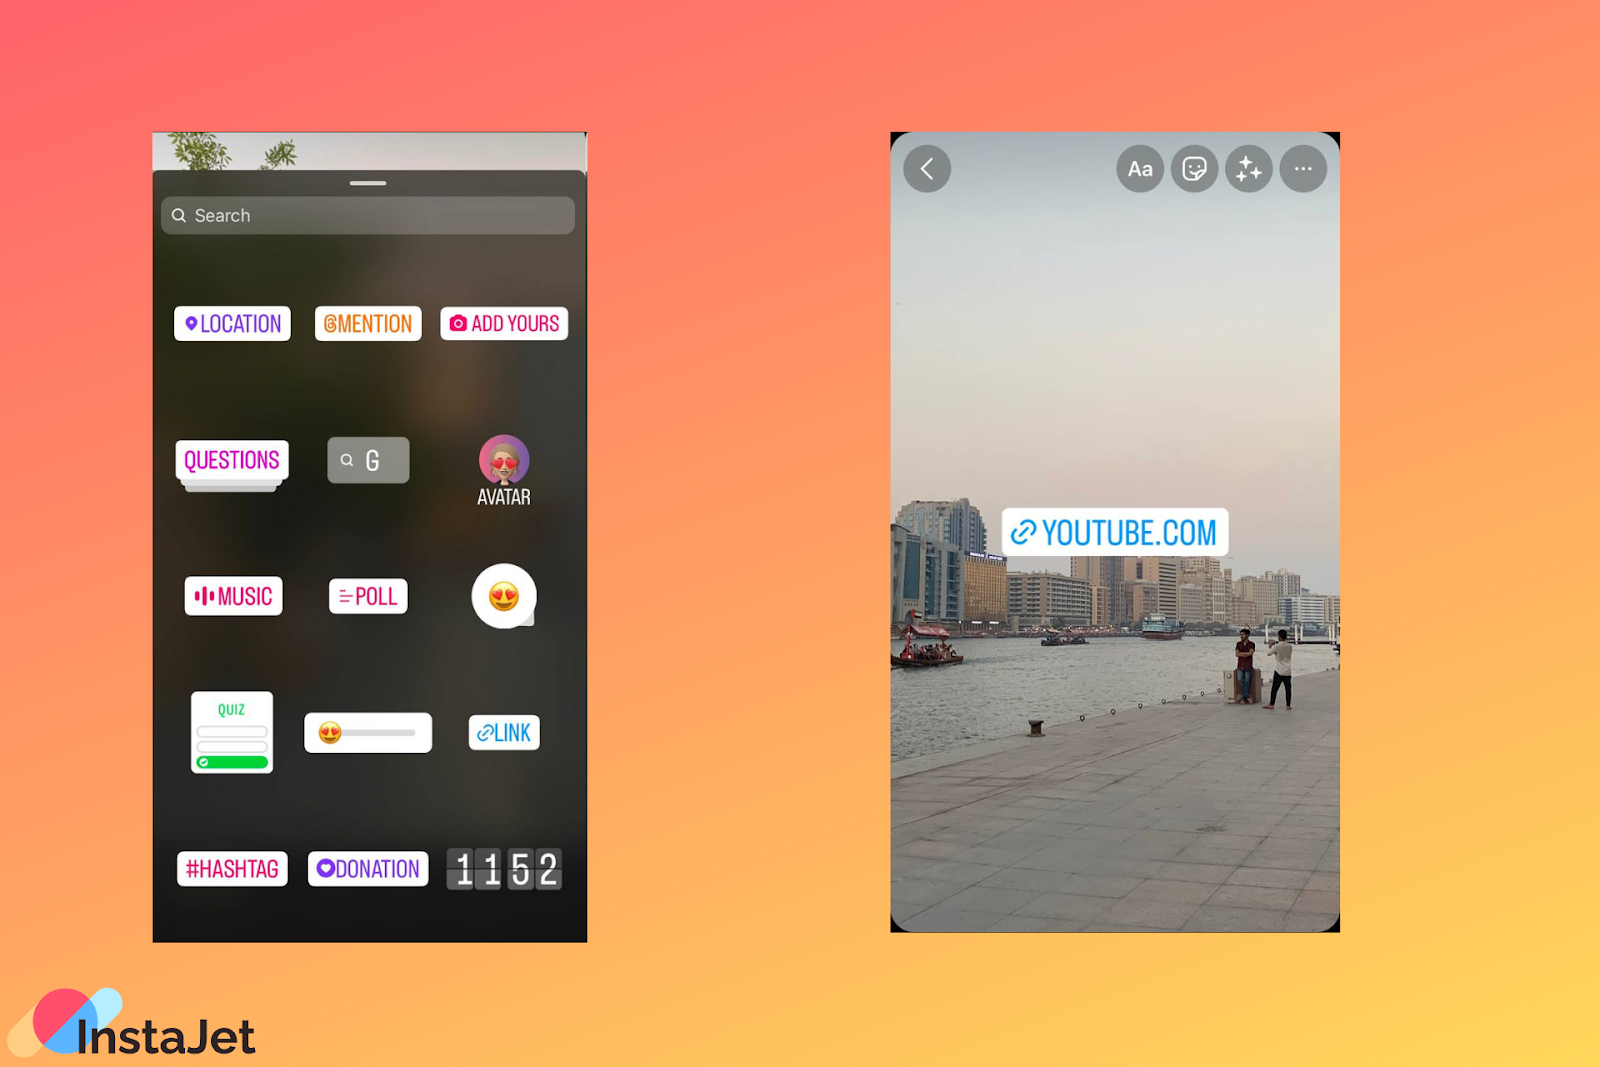
Before we get into the different types of metrics and indicators, it should be noted that metrics may differ from Story to Story depending on actions of users, i.e. whether they pressed links/stickers, etc. If you've attached a link to a site or sticker mentioning an account to your Stories, you'll be able to also see the click-through statistics. For accounts with less than 10 000 followers there is a test opportunity to attach a link via a "link sticker”. However, please note that statistics for this sticker are not available yet.
When choosing filters in the statistics tab, you can select the following metrics:
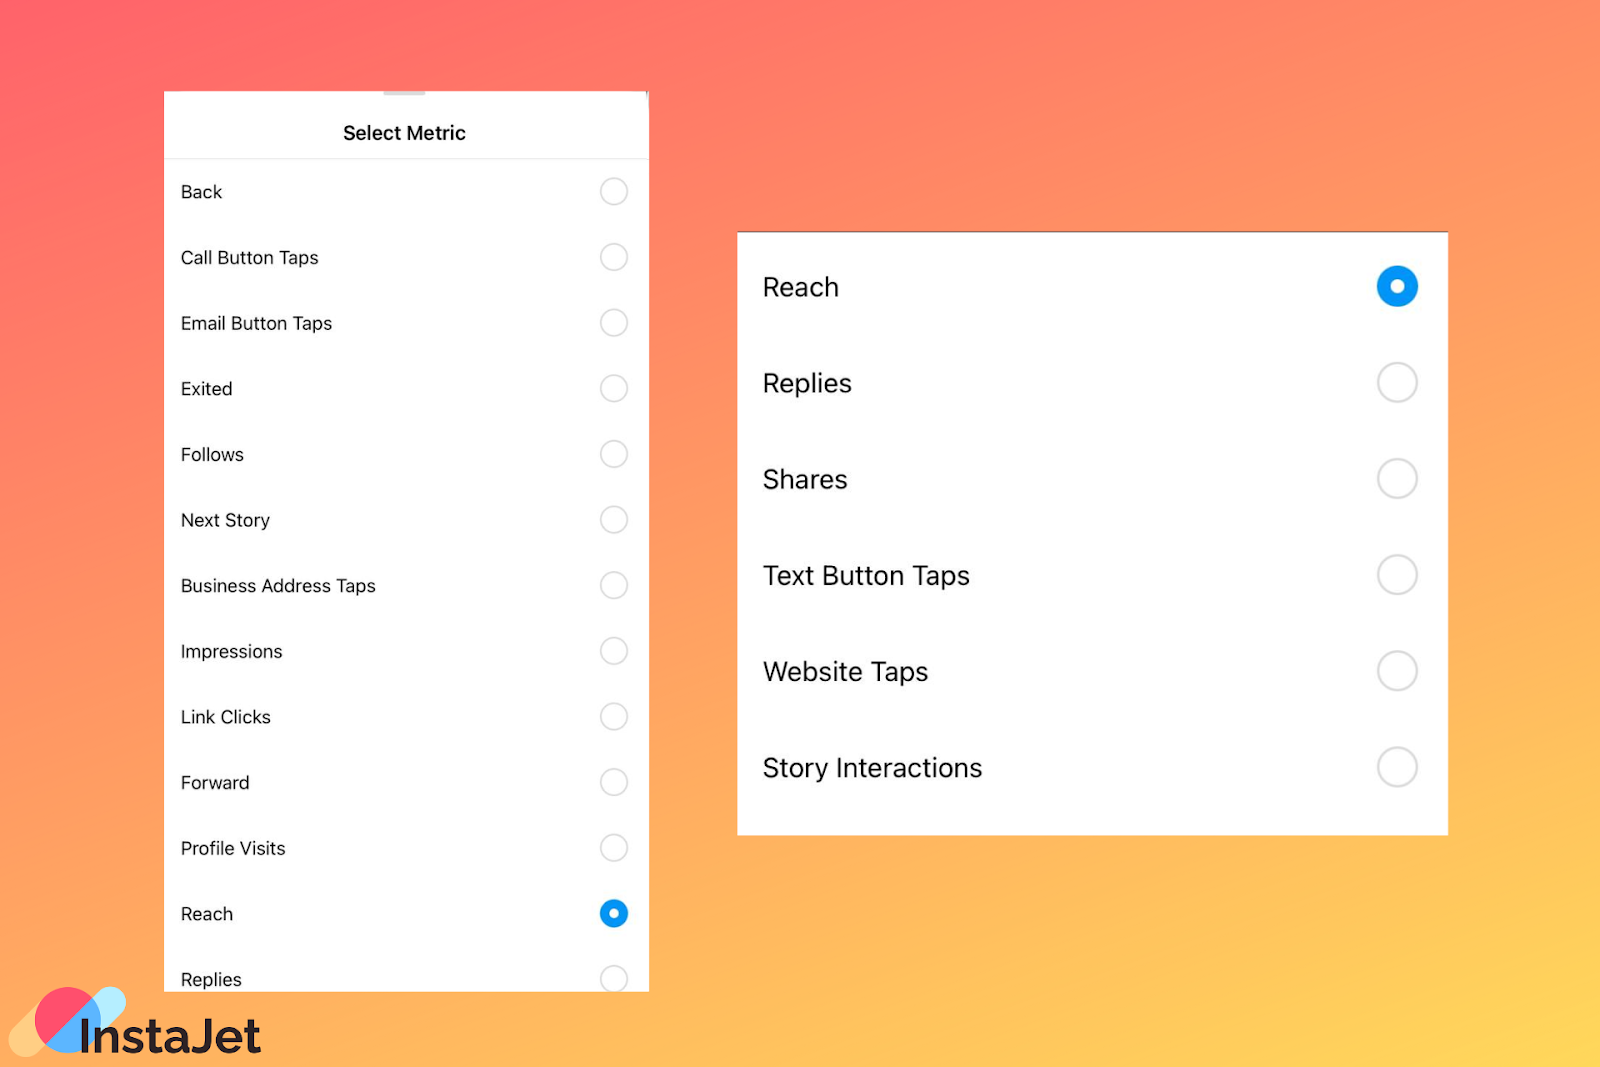
Navigation metrics
"Navigation" - the sum of values of all metrics in the section.
"Back" (when viewing the stats of an individual Story, this is "Go Back") - allows you to see how many times the user has navigated to the previous Story to revisit it.
"Transitions to the next Story" (in the statistics of a separate Story it is "Go Forward") - shows the number of transitions to the next of your Stories. The indicator counts even if the user didn't watch your Story till the end.
"Next Story" - shows the jumps from your Story to other users' Stories.
"Exits" - shows the number of users who have closed the Story and left the section.
Coverage and Subscribers Metrics
"Reach" - the number of unique users who have viewed your Story.
"Views" - The sum of all views of the Story. This includes multiple views by the same user.
"Subscriptions" - shows the number of accounts that have subscribed after viewing your Story.
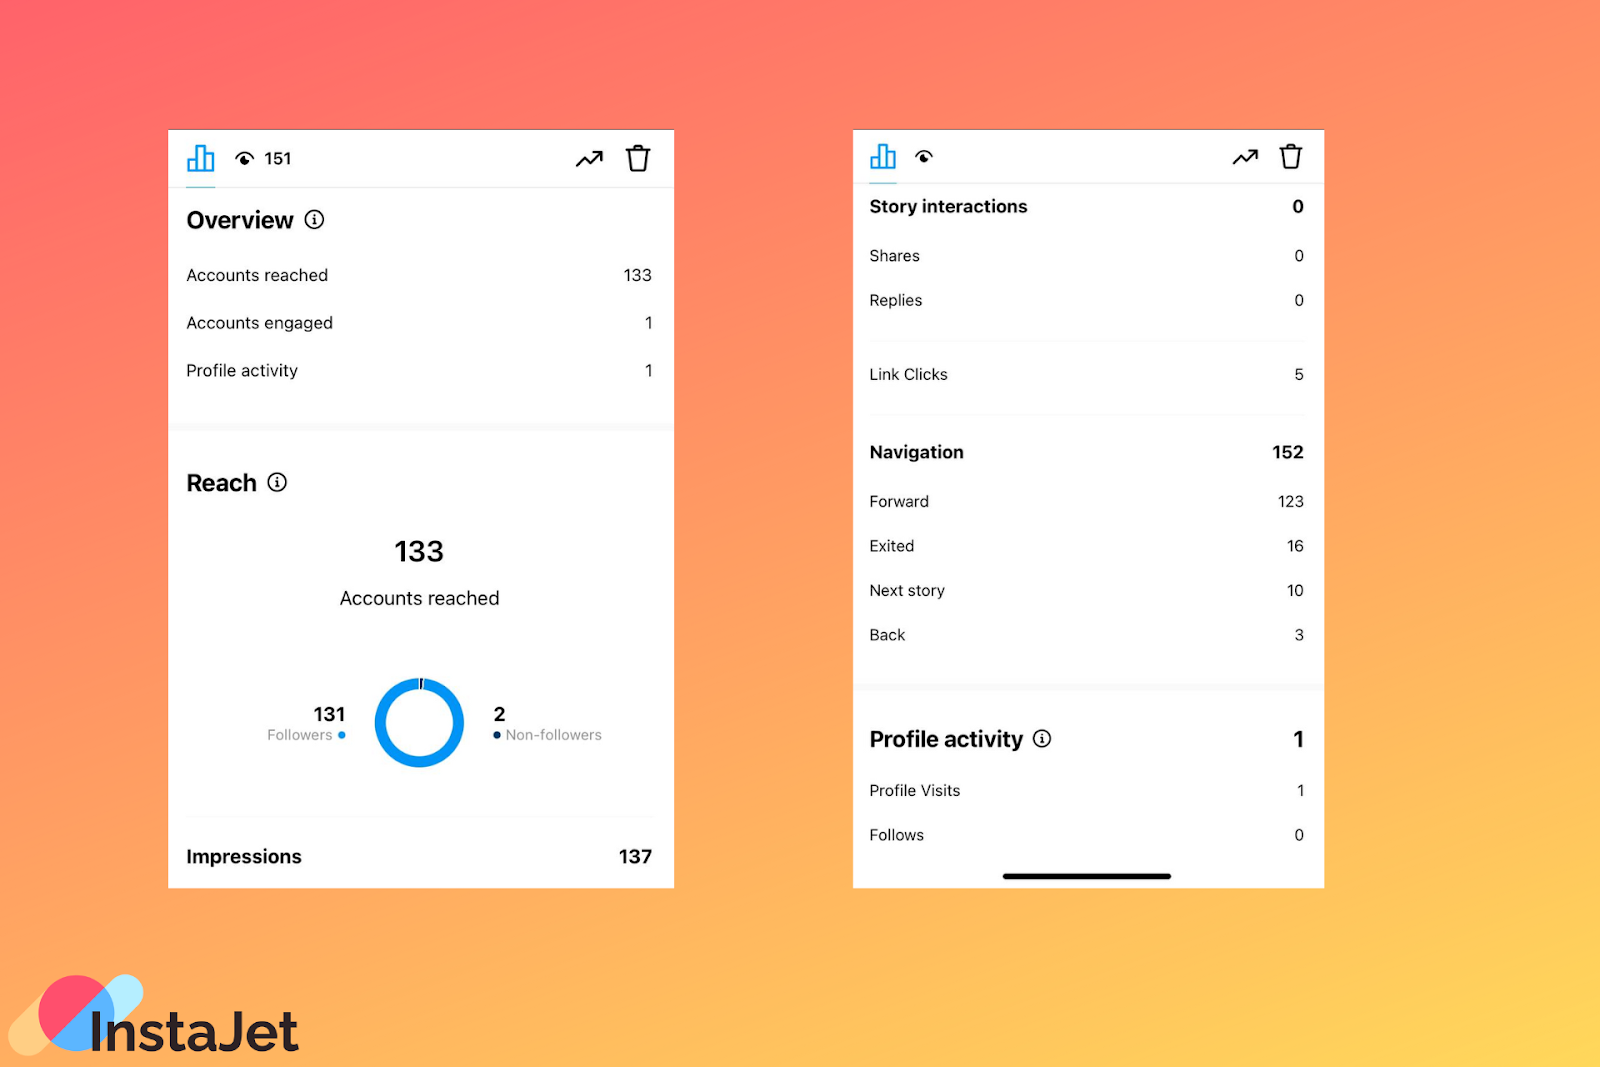
Interaction Metrics
"Story Interactions" - the sum of all metrics in the Interactions section.
"Link Clicks" - shows the number of clicks on the links attached to the Stories.
"Website taps" - allows you to view users who have moved to the site after viewing the Story. Not to be confused with the metric above.
"Replies" - shows the number of users who responded to your Stories, or who wrote to you in Direct.
"Profile Visits" - shows the number of people who visited your account from Stories via the avatar in the left corner.
"Number of Sticker Taps" - if you've attached a sticker with your account name (whether it's yours or someone else's), this metric will show how many people have clicked on the sticker. If you, for example, reposted someone else's Story, the metric will show the number of clicks on it. The stat will also show the name of the user.
Now that you know about the main types of metrics, all that’s left is to understand how to work with them!
As for working with Stories and using statistics for analysis, here you need to know 3 rules:
1. Negative actions (closes, swipes and no interactions) mean that your content is not interesting to subscribers.
2. Positive actions (repeat views, reactions and) allow your Stories to get closer to the top of the list and increase your reach.
3. You need to collect and compare data on the formats and content of your Stories for more effective analysis.
How to make money from integrations in Stories
Users interested in making money through Stories will find the InstaJet service extremely useful. InstaJet is a marketplace that connects bloggers and businesses to each other. Bloggers get regular orders, and companies save time that could have been spent searching for Influencers, negotiating and other routine tasks. The platform guarantees transaction security: money is transferred to the performer only after publication. For Influencers, the platform guarantees a constant income from integrations among the target audience with a minimum of effort.
InstaJet works with bloggers with an audience of at least 10 thousand subscribers. Bloggers can join InstaJet and start collaborating with brands by filling out the form. Sign up and start earning!